How to Diagnose Entry Efficiency in Forex Trades Using MAE and MFE
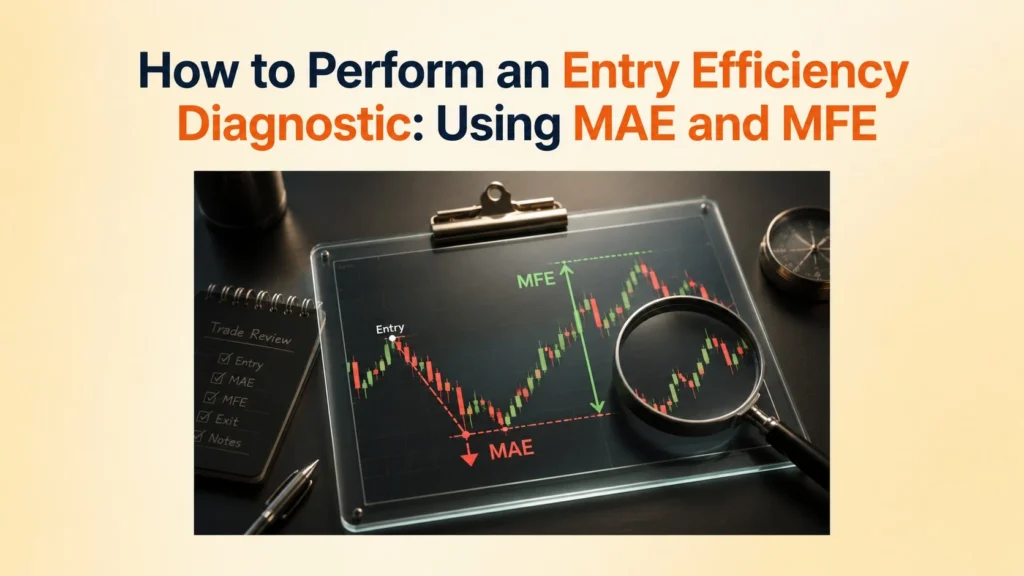
How to Diagnose Entry Efficiency in Forex Trades Using MAE and MFE To diagnose entry efficiency in forex trades using MAE and MFE, measure how far price moved against your trade and in your favor while the trade was open, then compare those excursions against your stop size, result, and entry method. This comparison reveals whether the trade used more risk than necessary, whether profit was available but unmanaged, or whether the entry came too late to preserve a strong reward profile. Many traders misread trade outcomes by assuming a loss means the setup was wrong, when the deeper issue may be wasted stop distance, late entry, or passive management after favorable movement appeared. Understanding entry efficiency diagnosis with MAE and MFE makes it easier to separate true setup weakness from waste in stop placement, profit capture, and order timing. The sections below break down the metrics, the data log, the two main diagnostic tests, the optimization logic, and the habits that improve execution quality. EDUCATIONAL DISCLAIMER This article is educational only and does not constitute financial advice. Trading foreign exchange on margin carries a high level of risk. What is entry efficiency diagnosis with MAE and MFE, and why does it matter? Entry efficiency diagnosis with MAE and MFE is the process of evaluating whether your entry, stop, and management match the asset’s actual price behavior, so you can identify wasted risk, missed profit, and weak execution. The purpose is not simply to judge whether the trade won or lost, but whether the trade used risk efficiently relative to what the market actually did. This framework matters because traders often pay for stop distance they do not need or fail to capture movement the market already offered. Core Concept Map Diagnostic Function Execution inefficiency Highlights stops set too wide, entries timed too late, or favorable movement left unmanaged. MAE Measures precisely how much heat the trade took. MFE Measures precisely how much opportunity the trade offered. Diagnosis goal Identifies testable changes to stop placement, entry location, and trade management without assuming that tighter is always better. Entry efficiency diagnosis with MAE and MFE matters because it shows whether your trading plan is paying for risk you do not need or failing to capture movement the market already offered. MAE is shown to the left of entry as adverse movement and MFE to the right as favorable movement.THE EFFICIENCY SPECTRUMMAEWasted risk / adverse heatMFEAvailable favorable movementENTRY POINTFOREXSHARED.COMFigure 1.0: The Efficiency Spectrum. MAE measures adverse movement from entry, while MFE measures favorable movement available during the trade. How do MAE and MFE make entry efficiency diagnosis measurable? MAE and MFE make entry efficiency diagnosis measurable by turning trade pain and trade opportunity into comparable data points that can be evaluated across winners, losers, and different execution styles. Maximum Adverse Excursion (MAE) is the maximum unrealized adverse move reached while a trade is open, and Maximum Favorable Excursion (MFE) is the maximum unrealized favorable move reached before the trade closes, which is why both metrics are useful for diagnosing stop placement and profit-capture quality [TradeZella, 2023]. Their combined use reveals not only whether the trade suffered, but whether it offered unused opportunity before it closed. How does MAE reveal entry inefficiency? MAE reveals entry inefficiency by showing how far price moved against the trade before it closed, making it easier to judge whether the stop was wider than valid setups actually required. MAE is especially important when analyzing winning trades, because it shows how much adverse movement successful setups usually tolerate. A stop can be technically valid and still inefficient if most winning trades never use much of it. How does MFE reveal management inefficiency? MFE reveals management inefficiency by showing how far price moved in your favor while the trade was open, helping expose profit that the market offered but the execution plan failed to capture. MFE becomes especially useful when losing trades had meaningful favorable movement before reversing. This can reveal a management flaw even when the final result was a full loss. Metric What it measures High reading usually suggests Low reading usually suggests MAE Worst move against entry while trade was open More heat taken before outcome Cleaner entry or tighter directional alignment MFE Best move in favor while trade was open More available profit during trade life Limited expansion after entry MAE vs Stop Portion of planned risk actually used Possible stop pressure or loose execution Possible excess stop room MFE vs Result Portion of available move actually captured Better management if realized Left-on-the-table risk if not realized MAE and MFE make entry efficiency diagnosis measurable because they show both how much pain the trade absorbed and how much opportunity it offered before it closed. What data should you collect to perform entry efficiency diagnosis correctly? To perform entry efficiency diagnosis correctly, you should collect a consistent set of trade records that captures stop size, excursion behavior, result, and entry logic in a form that can be compared across similar trades [Tradervue, 2024]. MAE/MFE analysis breaks down when trades from unrelated contexts are mixed without controls. For example, mixing GBP/JPY and EUR/CHF trades, or combining different execution timeframes, can create noisy conclusions unless the data is normalized for volatility. The journal must capture both trade behavior and execution context, not just the final result. Field Why it matters Trade ID Keeps each sample trackable Direction Distinguishes long from short behavior Stop loss in pips Defines planned risk MAE in pips Shows realized adverse excursion MFE in pips Shows realized favorable excursion Final result Tells whether the move was captured or wasted Entry trigger used Allows trigger-quality comparison Phase 3: The Data Collection Log Capture the same fields for your next 30 comparable trades. The first four completed rows reproduce the sample shown in the S5 Protocol PDF, while rows 5 through 30 are editable slots for your own trades. Every change saves automatically in this browser, and only fully completed rows are included in the