How to Diagnose Entry Efficiency in Forex Trades Using MAE and MFE
To diagnose entry efficiency in forex trades using MAE and MFE, measure how far price moved against your trade and in your favor while the trade was open, then compare those excursions against your stop size, result, and entry method. This comparison reveals whether the trade used more risk than necessary, whether profit was available but unmanaged, or whether the entry came too late to preserve a strong reward profile.
Many traders misread trade outcomes by assuming a loss means the setup was wrong, when the deeper issue may be wasted stop distance, late entry, or passive management after favorable movement appeared.
Understanding entry efficiency diagnosis with MAE and MFE makes it easier to separate true setup weakness from waste in stop placement, profit capture, and order timing. The sections below break down the metrics, the data log, the two main diagnostic tests, the optimization logic, and the habits that improve execution quality.
What is entry efficiency diagnosis with MAE and MFE, and why does it matter?
Entry efficiency diagnosis with MAE and MFE is the process of evaluating whether your entry, stop, and management match the asset’s actual price behavior, so you can identify wasted risk, missed profit, and weak execution.
The purpose is not simply to judge whether the trade won or lost, but whether the trade used risk efficiently relative to what the market actually did.
This framework matters because traders often pay for stop distance they do not need or fail to capture movement the market already offered.
| Core Concept Map | Diagnostic Function |
|---|---|
| Pricing inefficiency | Highlights stops set too wide, entries timed too late, or take-profits left too passive. |
| MAE | Measures precisely how much heat the trade took. |
| MFE | Measures precisely how much opportunity the trade offered. |
| Diagnosis goal | Drives tighter stops, smarter entries, and better R-multiples. |
How do MAE and MFE make entry efficiency diagnosis measurable?
MAE and MFE make entry efficiency diagnosis measurable by turning trade pain and trade opportunity into comparable data points that can be evaluated across winners, losers, and different execution styles.
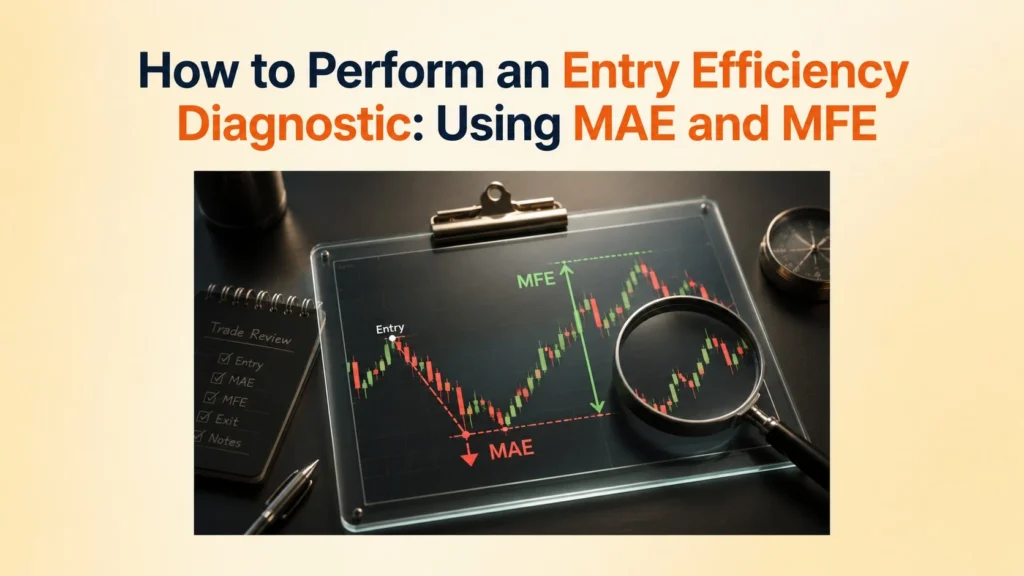
Maximum Adverse Excursion (MAE) is the maximum unrealized adverse move reached while a trade is open, and Maximum Favorable Excursion (MFE) is the maximum unrealized favorable move reached before the trade closes, which is why both metrics are useful for diagnosing stop placement and profit-capture quality [TradeZella, 2023].
Their combined use reveals not only whether the trade suffered, but whether it offered unused opportunity before it closed.
How does MAE reveal entry inefficiency?
MAE reveals entry inefficiency by showing how far price moved against the trade before it closed, making it easier to judge whether the stop was wider than valid setups actually required. MAE is especially important when analyzing winning trades, because it shows how much adverse movement successful setups usually tolerate. A stop can be technically valid and still inefficient if most winning trades never use much of it.
How does MFE reveal management inefficiency?
MFE reveals management inefficiency by showing how far price moved in your favor while the trade was open, helping expose profit that the market offered but the execution plan failed to capture. MFE becomes especially useful when losing trades had meaningful favorable movement before reversing. This can reveal a management flaw even when the final result was a full loss.
| Metric | What it measures | High reading usually suggests | Low reading usually suggests |
|---|---|---|---|
| MAE | Worst move against entry while trade was open | More heat taken before outcome | Cleaner entry or tighter directional alignment |
| MFE | Best move in favor while trade was open | More available profit during trade life | Limited expansion after entry |
| MAE vs Stop | Portion of planned risk actually used | Possible stop pressure or loose execution | Possible excess stop room |
| MFE vs Result | Portion of available move actually captured | Better management if realized | Left-on-the-table risk if not realized |
What data should you collect to perform entry efficiency diagnosis correctly?
To perform entry efficiency diagnosis correctly, you should collect a consistent set of trade records that captures stop size, excursion behavior, result, and entry logic in a form that can be compared across similar trades [Tradervue, 2024].
MAE/MFE analysis breaks down when trades from unrelated contexts are mixed without controls. For example, comparing a spot EUR/USD trade to an NDF fixing date trade or a transaction involving restricted currency pair referencing without normalization creates noisy data.
The journal must capture both trade behavior and execution context, not just final result.
| Field | Why it matters |
|---|---|
| Trade ID | Keeps each sample trackable |
| Direction | Distinguishes long from short behavior |
| Stop loss in pips | Defines planned risk |
| MAE in pips | Shows realized adverse excursion |
| MFE in pips | Shows realized favorable excursion |
| Final result | Tells whether the move was captured or wasted |
| Entry trigger used | Allows trigger-quality comparison |
- MAE (Adverse): If you went Long at 1.1000 and price dropped to 1.0995 before going up, your MAE is 5 pips.
- MFE (Favorable): If you went Long at 1.1000 and price hit 1.1045 before you closed it, your MFE is 45 pips.
Interactive S5 Functional Tracker
Input your recent trades below to automatically calculate your Stop-Loss Bloat and Left on the Table metrics in real-time.
Diagnostic Insights (Auto-Calculated)
How do winning trades reveal whether your stop loss is too loose?
Winning trades reveal whether your stop loss is too loose by showing how much adverse movement valid setups usually tolerate before they work, making it possible to compare real excursion behavior against your fixed stop size.
This test works by isolating winning trades and comparing their average MAE to the current fixed stop.
If winners rarely use most of the allowed stop distance, the stop may be wider than necessary.
| Metric | Value |
|---|---|
| Fixed stop size | 20 pips |
| Average MAE of winners | 8 pips |
| Median MAE of winners | 7 pips |
| Unused stop distance | 12 pips |
| Winner stop-use ratio | 0.40 |
| Unused stop percentage | 60% |
Formula Note: Winner stop-use ratio = Average winner MAE ÷ Fixed stop. Unused stop % = (Fixed stop − Average winner MAE) ÷ Fixed stop × 100.
How do losing trades reveal passive trade management or missed profit opportunities?
Losing trades reveal passive trade management or missed profit opportunities when they show meaningful positive MFE before eventually closing at a loss, indicating that the market offered usable movement that was never protected or realized.
This test isolates losing trades and examines whether they went meaningfully positive before reversing.
If this happens often, the problem may be management passivity rather than directional failure.
| Metric | Value |
|---|---|
| Fixed stop size | 20 pips |
| Average MFE of losing trades | 14 pips |
| Median MFE of losing trades | 12 pips |
| Average final result of those trades | -20 pips |
| Opportunity-to-stop ratio | 0.70 |
| Breakeven opportunity present? | Yes, repeatedly |
Formula Note: Opportunity-to-stop ratio = Average loser MFE ÷ Fixed stop.
When does entry efficiency diagnosis point to a real optimization opportunity?
Entry efficiency diagnosis points to a real optimization opportunity when excursion data repeatedly shows unused stop room, unmanaged favorable movement, or entry placement that compresses reward potential.
A real optimization opportunity is not one unusual trade, but a repeated pattern across a meaningful sample.
The next action depends on whether the repeated waste appears in stop sizing, management, or entry timing.
When does the data suggest the stop loss is too loose?
The data suggests the stop loss is too loose when winning trades use much less adverse room than the current stop allows and the average MAE of winners remains far below the fixed stop size. This pattern suggests tighter risk may preserve most winners without sharply increasing invalid stop-outs.
When does the data suggest management is too passive?
The data suggests management is too passive when losing trades frequently show meaningful positive MFE before failing, indicating that available profit was repeatedly allowed to disappear. This pattern may justify testing earlier breakeven rules or partial-profit logic.
When does the data suggest the entry is consistently late?
The data suggests the entry is consistently late when trades show low MAE and low MFE together, implying that the position entered after much of the useful movement had already occurred. Late entries reduce reward expansion even when the directional idea is correct.
| Repeated pattern | Numeric clue | Likely issue | Next test |
|---|---|---|---|
| Winners use far less than full stop | Winner stop-use ratio below 0.50 | Stop too loose | Test tighter stop |
| Losers show strong positive MFE before loss | Opportunity-to-stop ratio above 0.50 | Management too passive | Test partials or earlier protection |
| Trades show low MAE and low MFE together | Both excursions compressed | Entry likely late | Test better entry location |
| Same setup behaves differently by trigger | One trigger has lower MAE and higher MFE | Trigger quality differs | Split trigger rules |
How should you turn entry efficiency diagnosis into a testable trading hypothesis?
You should turn entry efficiency diagnosis into a testable trading hypothesis by translating repeated waste patterns into one precise rule change that can be measured over the next sample of comparable trades.
The purpose of diagnosis is not random tweaking but structured testing.
Each hypothesis should adjust only one variable at a time so its effect can be observed clearly.
The S5 Protocol Insight Statement
Fill in the blanks using your tracker data to form a definitive diagnosis:
“The data strongly suggests my Stop Loss is [Too Loose / Too Tight]. My average Winning Trade only endures [X] pips of drawdown, yet my fixed Stop Loss is [Y] pips.”
Mathematical Impact of Optimization
Hypothesis (If Stop is Too Loose): “By tightening my Stop Loss from 20 pips to 12 pips (based on Average MAE + Buffer), I can increase my Position Size by 40% without increasing my risk.”
- Risking $100 with a 20 pip stop = $5/pip.
- Risking $100 with a 12 pip stop = $8.33/pip.
- Result: You just gave yourself a 66% raise on every winning trade without risking more money.
| Trade type | MAE | MFE | Final result | Stop-use ratio | Capture quality | Interpretation |
|---|---|---|---|---|---|---|
| High-efficiency winner | 6 pips | 32 pips | +24 pips | 0.30 on 20-pip stop | Captured most of move | Entry and management aligned well |
| Low-efficiency winner | 15 pips | 28 pips | +14 pips | 0.75 on 20-pip stop | Moderate capture only | Setup won, but execution was bloated |
| Passive loser | 9 pips | 16 pips | -20 pips | 0.45 adverse before strong positive excursion | Poor protection | Opportunity was available but unmanaged |
| Late-entry trade | 3 pips | 7 pips | +4 pips | Low | Low | Entry happened after most expansion |
What habits improve entry efficiency after the diagnosis is complete?
The habits that improve entry efficiency after diagnosis are the ones that make execution measurable, comparable, and adjustable without relying on memory, emotion, or random rule changes.
Better execution comes from repeatable review habits, not one-off emotional corrections.
Structured journaling, disciplined execution, and batch review make the diagnosis process usable over time.
How does journaling improve entry efficiency?
Journaling improves entry efficiency by capturing repeatable MAE and MFE patterns that would otherwise be distorted by memory bias or selective storytelling. Journaling makes optimization evidence-based rather than intuitive.
How does execution discipline improve entry efficiency?
Execution discipline improves entry efficiency by keeping timeframe, trigger logic, and order behavior consistent enough for excursion data to remain comparable. Inconsistent execution creates noisy data and weak conclusions.
How does post-trade review improve entry efficiency?
Post-trade review improves entry efficiency by exposing stable excursion patterns across groups of trades and turning those patterns into rule-level improvements. Batch review prevents traders from overreacting to one or two isolated outcomes.
Problem: wasted risk or missed movement
Implication: execution quality may be weak even if setup logic is fine
Solution: journal consistently, compare excursions, and test one rule change at a time
What are the key takeaways from entry efficiency diagnosis with MAE and MFE?
The key takeaways from entry efficiency diagnosis with MAE and MFE center on using excursion data to identify wasted stop distance, missed favorable movement, and execution patterns that can be improved through structured testing.
R-multiples are useful here because they standardize trade outcomes by initial risk, and expectancy is best treated as the average R-value across a sample of trades [Van Tharp Institute, 2020].
What checklist should you use before changing your stop, entry, or management rules?
Before changing your stop, entry, or management rules, you should confirm that the excursion data comes from a meaningful sample and that the pattern you want to fix is stable rather than anecdotal.
Rule changes should only follow measured behavior, not frustration from a few recent trades.
The biggest mistake in trade optimization is changing rules without measuring behavior first. A better process starts by diagnosing where the waste actually lives, then turning that gap into a controlled trading hypothesis.
Use this framework to test whether your current stop, entry, and management rules are truly efficient or simply familiar.
Frequently Asked Questions
What is a good MAE for a winning trade?
A good MAE for a winning trade is one that stays well within your risk tolerance while validating your entry timing. If the MAE is constantly pushing the limits of your stop loss, your entry might be too early. If it is nearly zero, your entry timing is highly efficient.
How can MFE help me avoid leaving money on the table?
MFE shows the highest unrealized profit point your trade reached. If your journal consistently shows an MFE of 3R but your realized profit averages 1R, you are leaving 2R on the table, indicating that you need to test more aggressive take-profit or trailing-stop logic.
Should I change my stop loss based on just one trade’s MAE?
No. Excursion data should always be evaluated across a meaningful sample size of comparable trades. Changing your stop loss based on a single outcome invites randomness and ruins your expectancy metrics.