How to Diagnose Forex Strategy Fit Using Session Volatility and the S5 Protocol
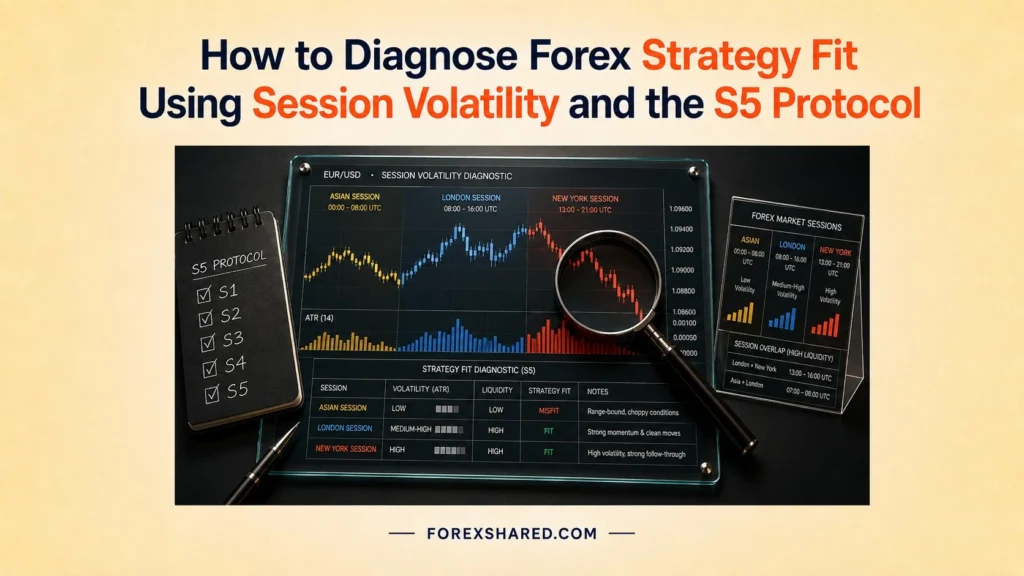
How to Diagnose Forex Strategy Fit How to Diagnose Forex Strategy Fit Using Session Volatility and the S5 Protocol The Session-Volatility S5 Protocol diagnoses whether a forex strategy fits the market environment where it is being traded. It separates trades by session, volatility profile, and news proximity to identify where performance improves or breaks down. The goal is to identify where performance improves or breaks down. The protocol tests strategy-environment mismatch, not trader talent, ensuring that systemic weaknesses are identified objectively. This protocol serves strictly as an educational risk-analysis framework, not a guaranteed profit system or emotional recovery program. Retail forex can involve substantial risk, leverage can magnify both gains and losses, and retail foreign currency offers may also carry fraud risk. EDUCATIONAL DISCLAIMER This article is educational only and does not constitute financial advice. Trading foreign exchange on margin carries a high level of risk. The frameworks provided analyze past execution logic and cannot guarantee future market returns, as there is no guaranteed risk-free strategy. What problem does the Session-Volatility S5 Protocol diagnose? The Session-Volatility S5 Protocol diagnoses strategy-environment mismatch by testing whether a forex strategy performs differently across sessions, volatility profiles, and news conditions. Inconsistent performance can happen even when entry rules stay the same. The suspected cause is market-environment mismatch, meaning the rules do not fit the current market state. This protocol tests when the strategy works, completely avoiding discipline diagnosis. Which mismatch is the protocol trying to isolate? The protocol is trying to isolate the gap between strategy rules and market condition. A trend setup can fail in slow chop, while a range setup can fail during aggressive expansion. What makes this different from a discipline diagnosis? This differs from a discipline diagnosis because a discipline diagnosis checks whether the trader followed the plan. Session-volatility diagnosis checks whether the plan fits the market window and movement condition. Where does session timing become a performance variable? Session timing becomes a performance variable when positive or negative R clusters around repeated market windows such as Asian, London, New York, or overlap sessions. [Investopedia, 2025] This protocol diagnoses whether a strategy is failing because it is being used in the wrong session or volatility environment. Session and Volatility Split Mixed trades are separated into session and volatility buckets. FOREXSHARED.COM RAW TRADES Unsorted execution data SESSION BUCKETS Grouped by time window VOLATILITY BUCKETS Grouped by market state S5 FILTER ENGINE Figure 1.0: Session & Volatility Split. Mixed trade results move through the S5 filter and split into session and volatility buckets for clearer environment comparison. Which environment variables define the S5 test? The Session-Volatility S5 Protocol defines the test through trading session, hourly volatility, news proximity, pair, strategy version, and timeframe. This matters because the global foreign exchange market is structurally large and multi-venue, so session and market-state analysis should be grounded in external market-structure context. [BIS, 2025] Variable Type Variable Diagnostic Role Environment Variable Trading Session Shows which market window produced the trade Environment Variable Hourly Volatility Shows whether the market was quiet, normal, fast, or extreme Event Variable News Proximity Flags high-impact news near the trade Control Variable Currency Pair Prevents pair behavior from contaminating the test Control Variable Strategy Version Keeps entry and exit rules stable Control Variable Timeframe Prevents scalping and swing data from mixing Control Variable Risk Rule Keeps R-multiple comparison fair Trading session, hourly volatility, and news proximity act as environment variables, while pair, strategy version, and timeframe act as control variables. Maintaining stable risk-per-trade using a position size calculator keeps the evaluation structured. Which variable identifies the market window? Trading session identifies the market window where the trade happened. Consistent labels such as Asian, London, New York, and London-New York overlap must be used to group data accurately. [Investopedia, 2025] What does hourly volatility reveal? Hourly volatility reveals whether the trade occurred during slow, normal, fast, or unstable movement. The assigned label must remain consistent before the final result is interpreted. Where do controls protect the diagnosis? Controls protect the diagnosis by ensuring that pair, strategy version, timeframe, and risk rule stay completely stable. If these elements change, weak results may come from the control change rather than environment fit. The test needs environment variables to explain performance and control variables to prevent false conclusions. How should the S5 trade log capture session and volatility data? The Session-Volatility S5 Protocol requires a controlled trade log that records UTC time, pair, session, volatility profile, news proximity, R result, and environment notes. Diagnostic Asset: Session-Volatility S5 Trade Log Date/Time UTC Pair Session Active Volatility Profile News Proximity Result Notes AsianLondonNew YorkOverlap LowNormalHighExtreme NoneWithin 60 min AsianLondonNew YorkOverlap LowNormalHighExtreme NoneWithin 60 min AsianLondonNew YorkOverlap LowNormalHighExtreme NoneWithin 60 min Traders should use at least 30 trades as the starting diagnostic sample, requiring the same strategy, pair, and timeframe family. Historical backfilling is allowed only if the opening time and labels are applied consistently. Which timestamp standard prevents session confusion? The UTC timestamp standard prevents session confusion for every single logged trade. Session labels should be assigned from the exact same time reference to avoid local-time contamination. What should the volatility label describe? The volatility label should describe the movement at entry, distinguishing whether the market was slow, narrow, choppy, normal, expanded, directional, unstable, or shock-driven. Where should qualitative notes stay useful? Qualitative notes stay useful when they describe factual environment behavior instead of emotional storytelling. Useful notes explicitly record chop, impulse, spread expansion, news spike, failed breakout, slow fill, or sudden reversal. The log must record time, session, volatility, news proximity, and R-multiple so performance can be segmented by environment. Environment Data Logging A trade log feeds structured field cards into an S5 database. FOREXSHARED.COM TRADE ENTRY Raw price execution STRUCTURED LOG Categorized S5 records CHART DATA R-RESULT VOLATILITY SESSION Figure 2.0: Environment Data Logging. Raw trade entries are converted into session, volatility, news, and R-result fields that can be reviewed consistently. How should volatility be classified inside the S5 Protocol? The Session-Volatility S5 Protocol classifies
How to Diagnose the Source of Forex Drawdown Using the S5 Protocol
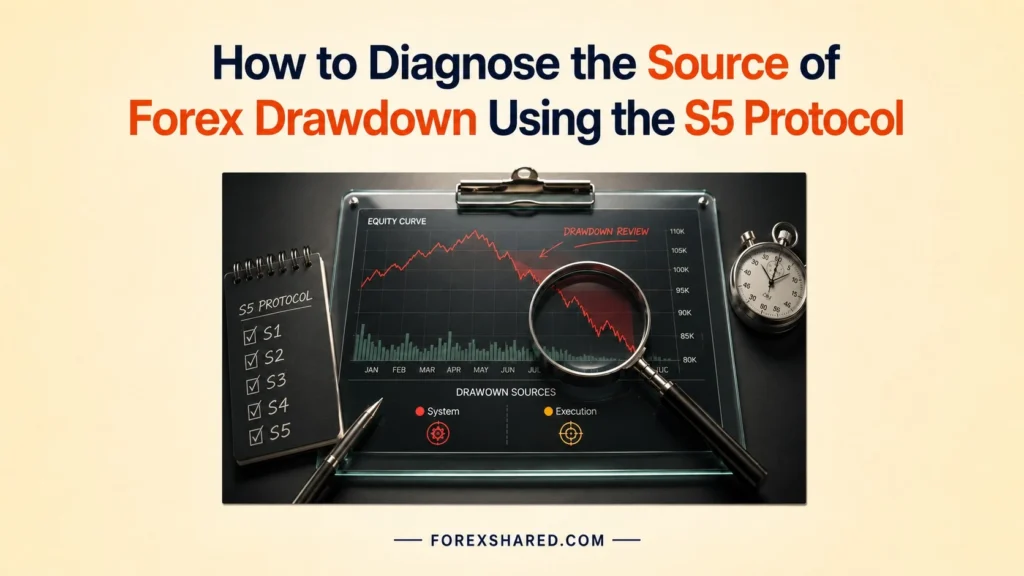
How to Diagnose the Source of Forex Drawdown Using the S5 Protocol The Drawdown Source Diagnostic S5 Protocol identifies whether account equity erosion is mainly caused by system failure or discipline failure. It strictly separates trades that faithfully followed the written plan from trades that broke the rules. By relying on an objective R-multiple comparison, this diagnostic framework reveals the exact mathematical origin of the ongoing losses. However, this protocol serves strictly as an educational risk-analysis framework, not a guaranteed profit system or emotional recovery program. The Commodity Futures Trading Commission warns that off-exchange forex trading by retail investors is “at best extremely risky”. Consequently, traders must utilize this tool strictly to diagnose structural failures before considering live execution. A structured diagnostic protocol replaces guesswork with measurable execution data. By systematically sorting a controlled sample of trades, participants can accurately categorize their drawdown source. The following sections detail the required variables, the trade collection process, the bucket comparison logic, and the testable hypotheses necessary for executing this protocol correctly. EDUCATIONAL DISCLAIMER This article is educational only and does not constitute financial advice. Trading foreign exchange on margin carries a high level of risk. The frameworks provided analyze past execution logic and cannot guarantee future market returns, as there is no guaranteed risk-free strategy. What problem does the Drawdown Source Diagnostic S5 Protocol diagnose? The Drawdown Source Diagnostic S5 Protocol diagnoses sustained account equity erosion, measured as a peak-to-trough decline in capital, by separating strategy weakness from trader execution weakness [Investopedia, 2024]. It does not judge one trade in isolation; instead, it looks for repeated loss patterns across a controlled sample to isolate the true cause without emotional blame. Which failure sources must be separated first? System failure and discipline failure exist as two entirely different causes of drawdown. System failure means the strategy performs poorly even when executed flawlessly. Discipline failure means the strategy itself may work perfectly, but the trader consistently damages the final results through continuous rule-breaking. What makes drawdown analysis unreliable without separation? Mixed trade data completely hides the actual source of sustained losses. Emotional execution errors can easily make a highly effective strategy look fundamentally broken. Conversely, normal statistical losses can make a valid system feel psychologically wrong, prompting traders to abandon functional plans prematurely. Where does the protocol create diagnostic clarity? The protocol immediately creates diagnostic clarity by labeling each trade as either clean strategy data or polluted execution data. It then compares these two specific groups separately, ensuring that erratic human behavior is never accidentally evaluated as a mathematical system failure. The Drawdown Source Diagnostic S5 Protocol accurately diagnoses equity drawdown by meticulously separating fundamental strategy performance from erratic trader behavior across a strictly controlled trade sample. THE DIAGNOSTIC SPLIT SYSTEM FAILURE Rules applied perfectly, still lost DISCIPLINE FAILURE Rules broken, execution corrupted MIXED DRAWDOWN DATA CLEAN SYSTEM ERRATIC EXECUTION FOREXSHARED.COM Figure 1.0: The Diagnostic Split. Demonstrating how mixed drawdown data must physically separate into clean system data and polluted execution data for analysis. Which variables identify the true drawdown source? The Drawdown Source Diagnostic S5 Protocol identifies the true drawdown source by using Plan Adherence as the primary variable and controlling risk, timeframe, strategy version, setup grade, and market state. These precise components filter out random noise and isolate the exact origin of the losses. Variable Type Variable Diagnostic Role Primary Variable Plan Adherence Separates valid strategy data from polluted execution data Quality Variable Setup Grade Shows whether losses cluster in weak or strong setups Environment Variable Market State Reveals whether the system fails in certain conditions Control Variable Risk Per Trade Keeps trade outcomes comparable Control Variable Timeframe Prevents mixed-style data contamination Control Variable Strategy Version Prevents rule changes during the sample Which variable acts as the diagnostic gatekeeper? Plan Adherence consistently acts as the ultimate gatekeeper variable. A trade that strictly follows the plan immediately becomes valid system data. Conversely, any trade that breaks the rules instantly becomes execution-error data, completely disqualified from evaluating the underlying strategy’s actual edge. What does setup quality add to the diagnosis? Setup grade clearly shows whether losing trades cluster aggressively inside weak, low-probability setups. By systematically logging this variable, the protocol cleanly separates poor, impulsive trade selection from poor overall strategy design, revealing if the trader simply takes too many suboptimal entries. Where do control variables protect the test? Risk, timeframe, and strategy version must stay strictly stable to protect the test’s integrity. Utilizing a consistent position size calculator keeps the risk-per-trade perfectly flat, anchoring the evaluation in a measured risk-management process [CFA Institute, 2026]. If any of these controls change mid-evaluation, the entire sample becomes fundamentally impossible to trust. The protocol needs one golden variable, Plan Adherence, powerfully supported by setup grade, market state, and strict execution controls to cleanly identify the true drawdown source. How should the trade data be collected for the S5 test? The Drawdown Source Diagnostic S5 Protocol requires a controlled trade log that records both numeric outcome and execution behavior. Participants must collect a minimum controlled sample before drawing any conclusions, keeping the sample large enough to show a pattern but small enough to review consistently. Interactive: Drawdown Source S5 Trade Log (Fill in your last 20 trades) Date Pair Setup Grade Plan Adherence Result (R) Qualitative Notes ABC YesNo ABC YesNo ABC YesNo ABC YesNo Which columns prevent emotional rewriting after the trade? The Plan Adherence column forcefully prevents post-trade story-changing, while the R-multiple column standardizes the outcome mathematically. The notes column securely captures behavioral context while the environment is still fresh, ensuring the trader cannot invent new, defensive explanations weeks later. What does the result column need to measure? The result column must measure the outcome in R-multiple rather than only recording raw monetary value. This deliberate standardization allows trades with entirely different lot sizes or currency pairs to be accurately compared directly through their initial planned risk. Where should qualitative notes stay controlled? Qualitative notes should strictly describe factual behavior rather than emotional excuses. Good